Intelligent Data Visualization
AUTOVIZ uses advanced AI to automatically generate the most insightful visualizations for your data

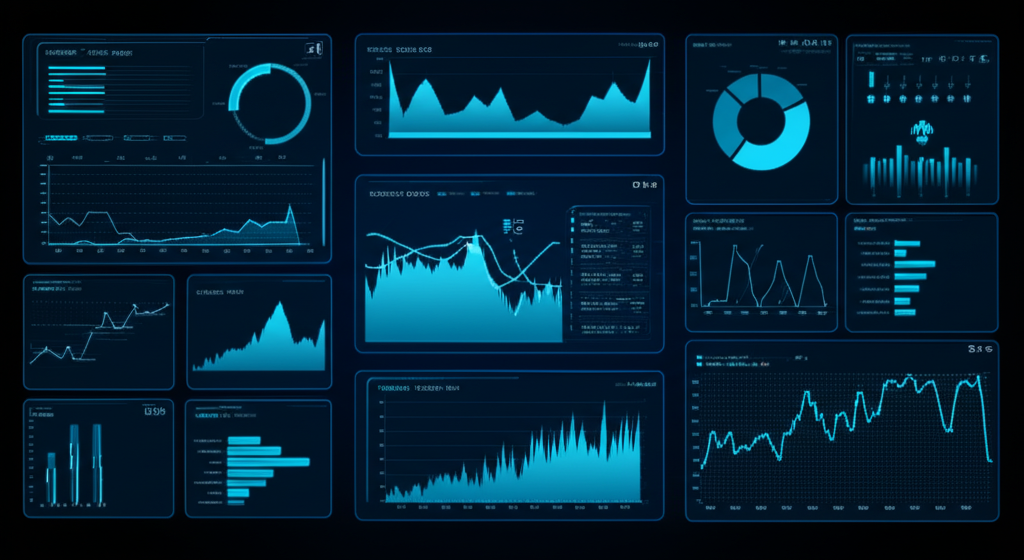
Smart Charts
Our AI automatically selects the best chart type for your data, ensuring the most effective visualization for your specific dataset.
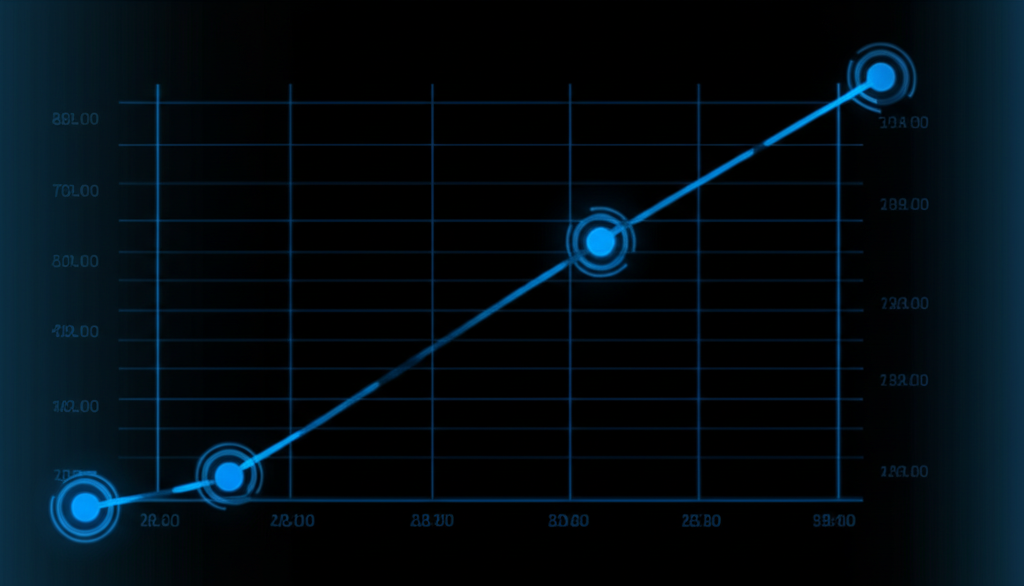
Trend Analysis
Identify and visualize patterns in your time-series data with advanced algorithms that detect seasonality and trends.
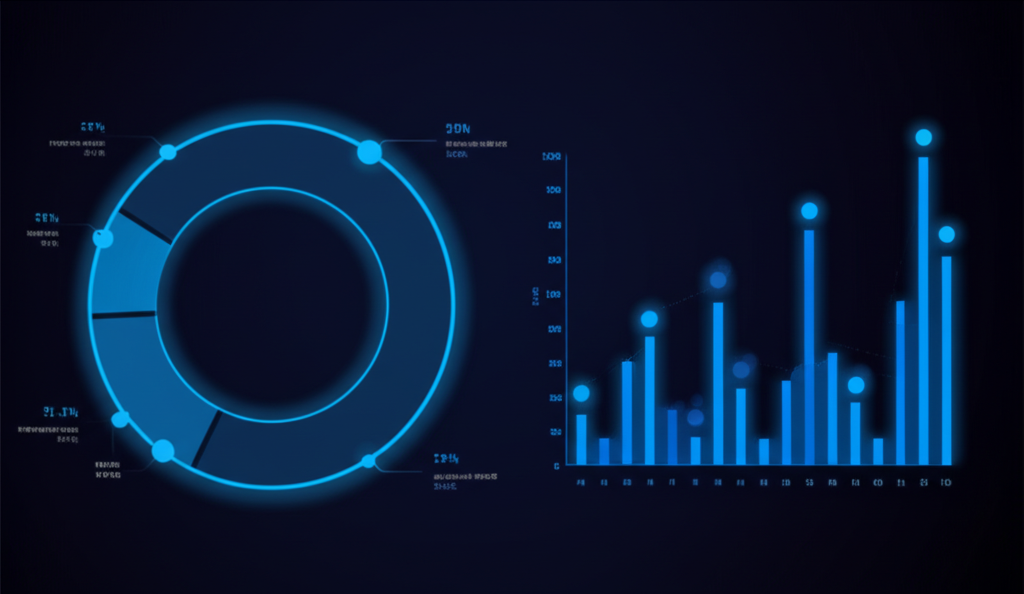
Distribution Insights
Visualize data distributions with intelligent grouping and categorization to reveal hidden patterns and outliers.
Predictive Visuals
Forecast future trends with AI-powered predictive analytics that help you make data-driven decisions.
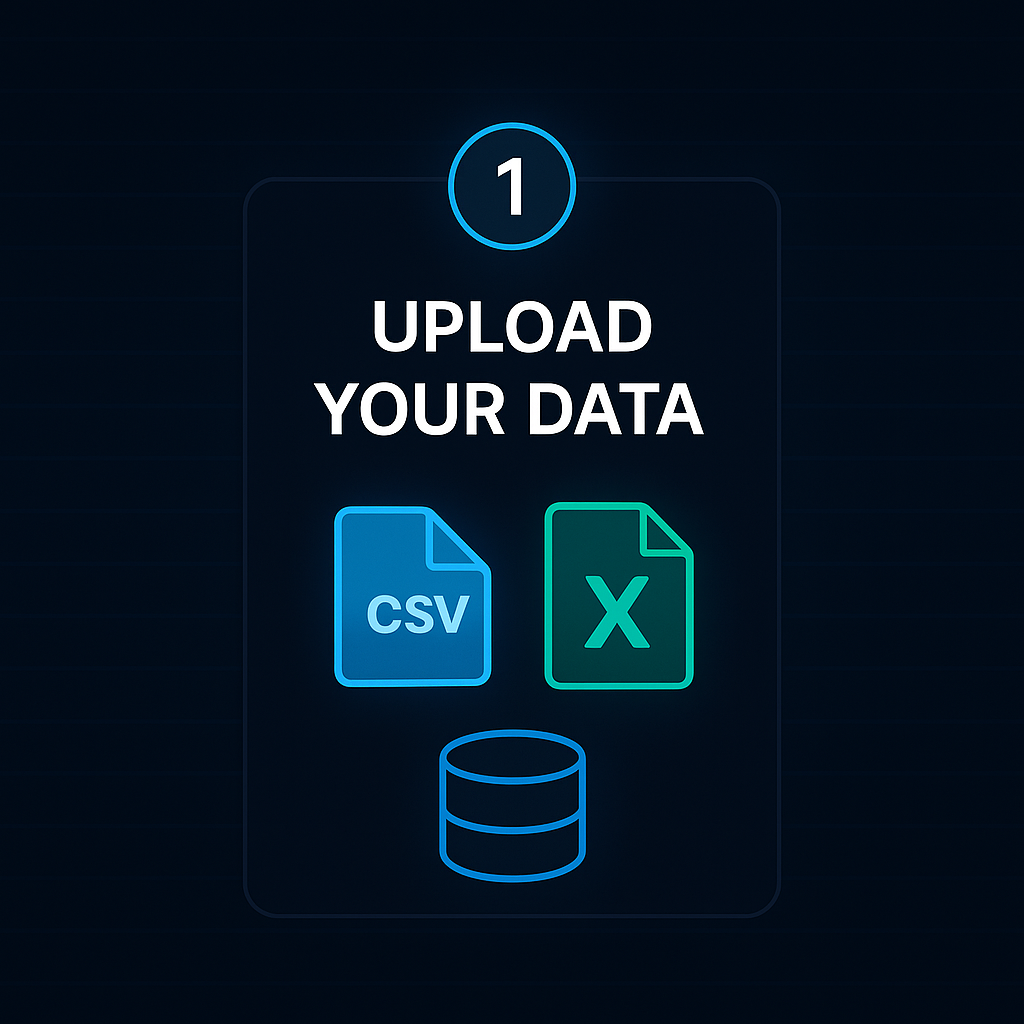
How AUTOVIZ Works
Three simple steps to transform your raw data into meaningful visualizations
Subscribe
Be the first to get updates and early access to AUTOVIZ