Features
Discover how AUTOVIZ transforms your data into meaningful visualizations

Smart Chart Selection
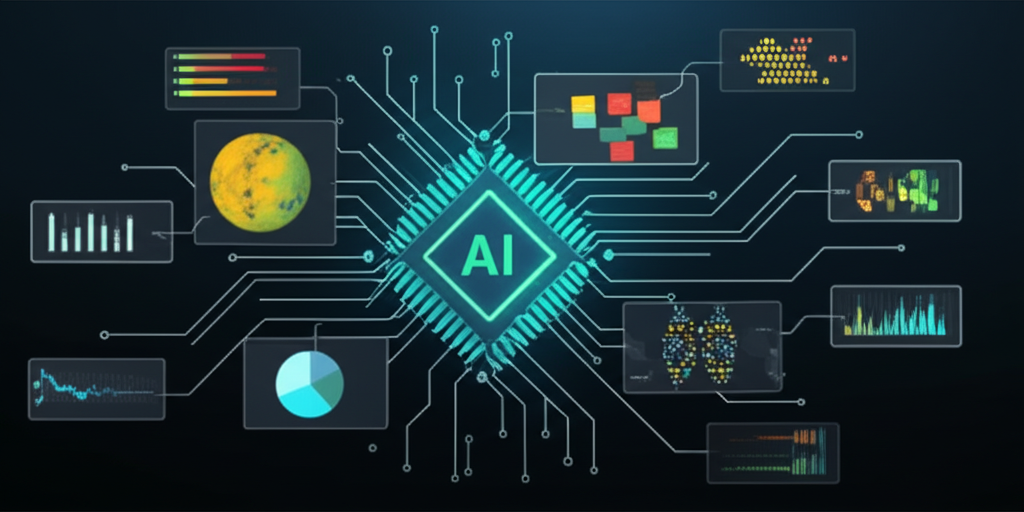
Our AI analyzes your data structure and automatically selects the most appropriate chart type to represent your data effectively. No more guessing which visualization works best.
Core Capabilities

Trend Analysis
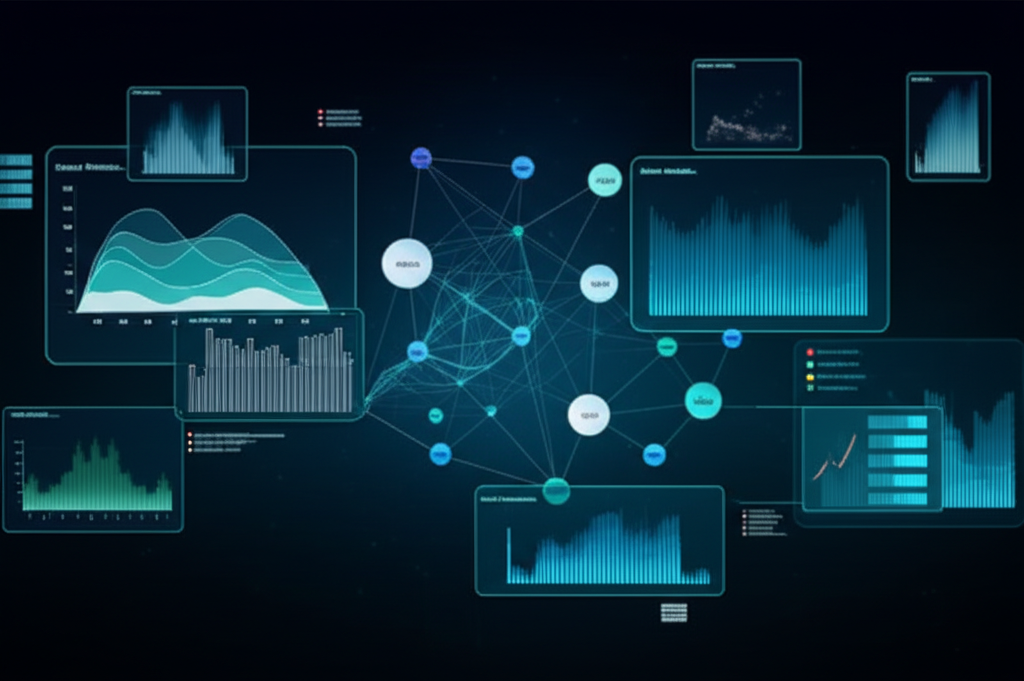
Automatically identify and visualize patterns in your time-series data with AI-powered trend detection.
- ✓ Automatic trend detection
- ✓ Seasonality analysis
- ✓ Anomaly highlighting

Distribution Insights
Visualize data distributions with intelligent grouping to reveal hidden patterns and outliers.
- ✓ Automatic data clustering
- ✓ Outlier detection
- ✓ Statistical summaries

Predictive Visuals
Forecast future trends with AI-powered predictive analytics for data-driven decisions.
- ✓ Future trend forecasting
- ✓ Confidence intervals
- ✓ Scenario modeling
More Powerful Features
AUTOVIZ provides a comprehensive suite of tools to help you get the most out of your data

Real-time Updates
Connect to live data sources for real-time visualization updates that keep your insights current.

Multiple Data Sources
Connect to various data sources including CSV, Excel, SQL databases, and third-party APIs.

Data Security
Enterprise-grade security features to keep your sensitive data protected at all times.